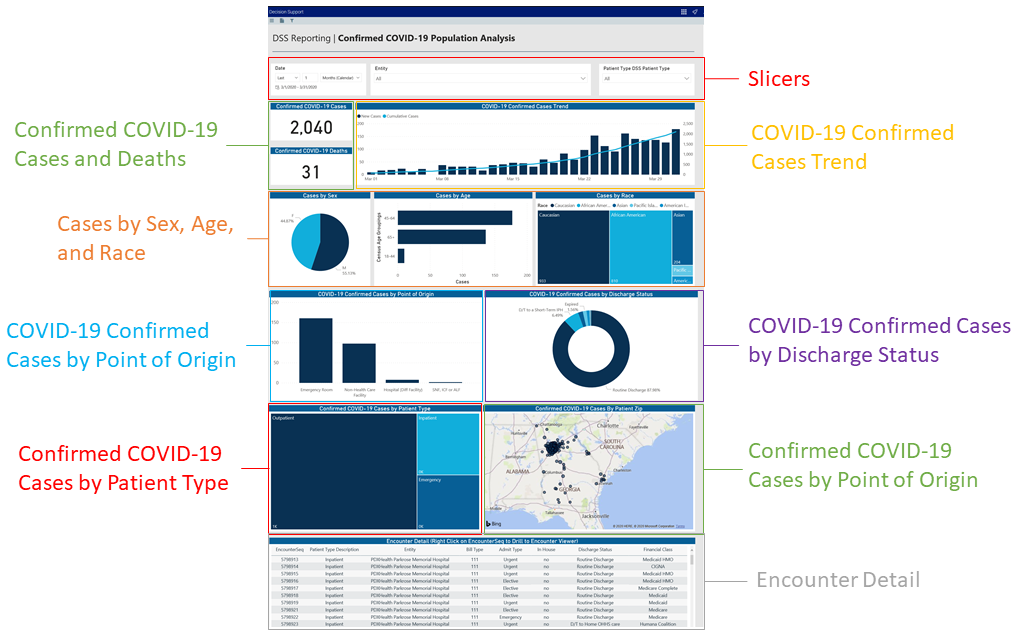
COVID-19 Population Analysis report
Overview
This page provides demographic, geographic, and operational data regarding COVID-19 patient populations.
To return to the dashboard home page, click the COVID-19 CDC Coding tab at the bottom of the page.
Click image to view full size
The following sections describe the different areas of this page.
Slicers
This section allows you to filter data by date (days, weeks, months, years), entity, and patient type. From the slicer drop-downs, you can select a combination of the available options to select the parameters to include in the views. The data and visuals in the report will dynamically update with the selection of the different parameters.

Click image to view full size
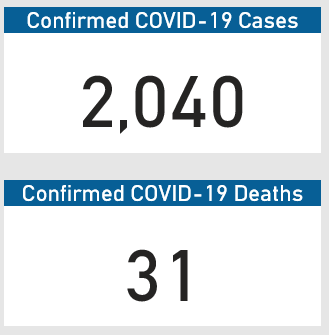
Confirmed COVID-19 Cases and Deaths
This section displays the number of COVID-19 cases and deaths across the population based on the parameters set in the Slicer section.
Click image to view full size
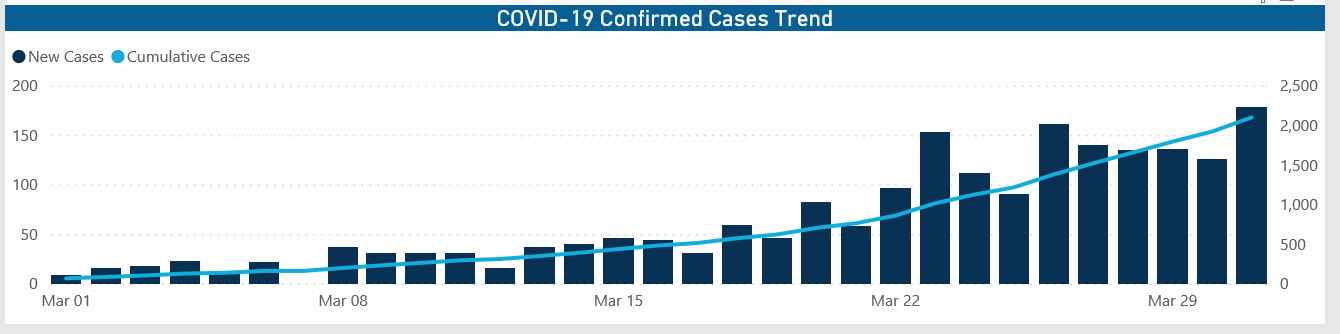
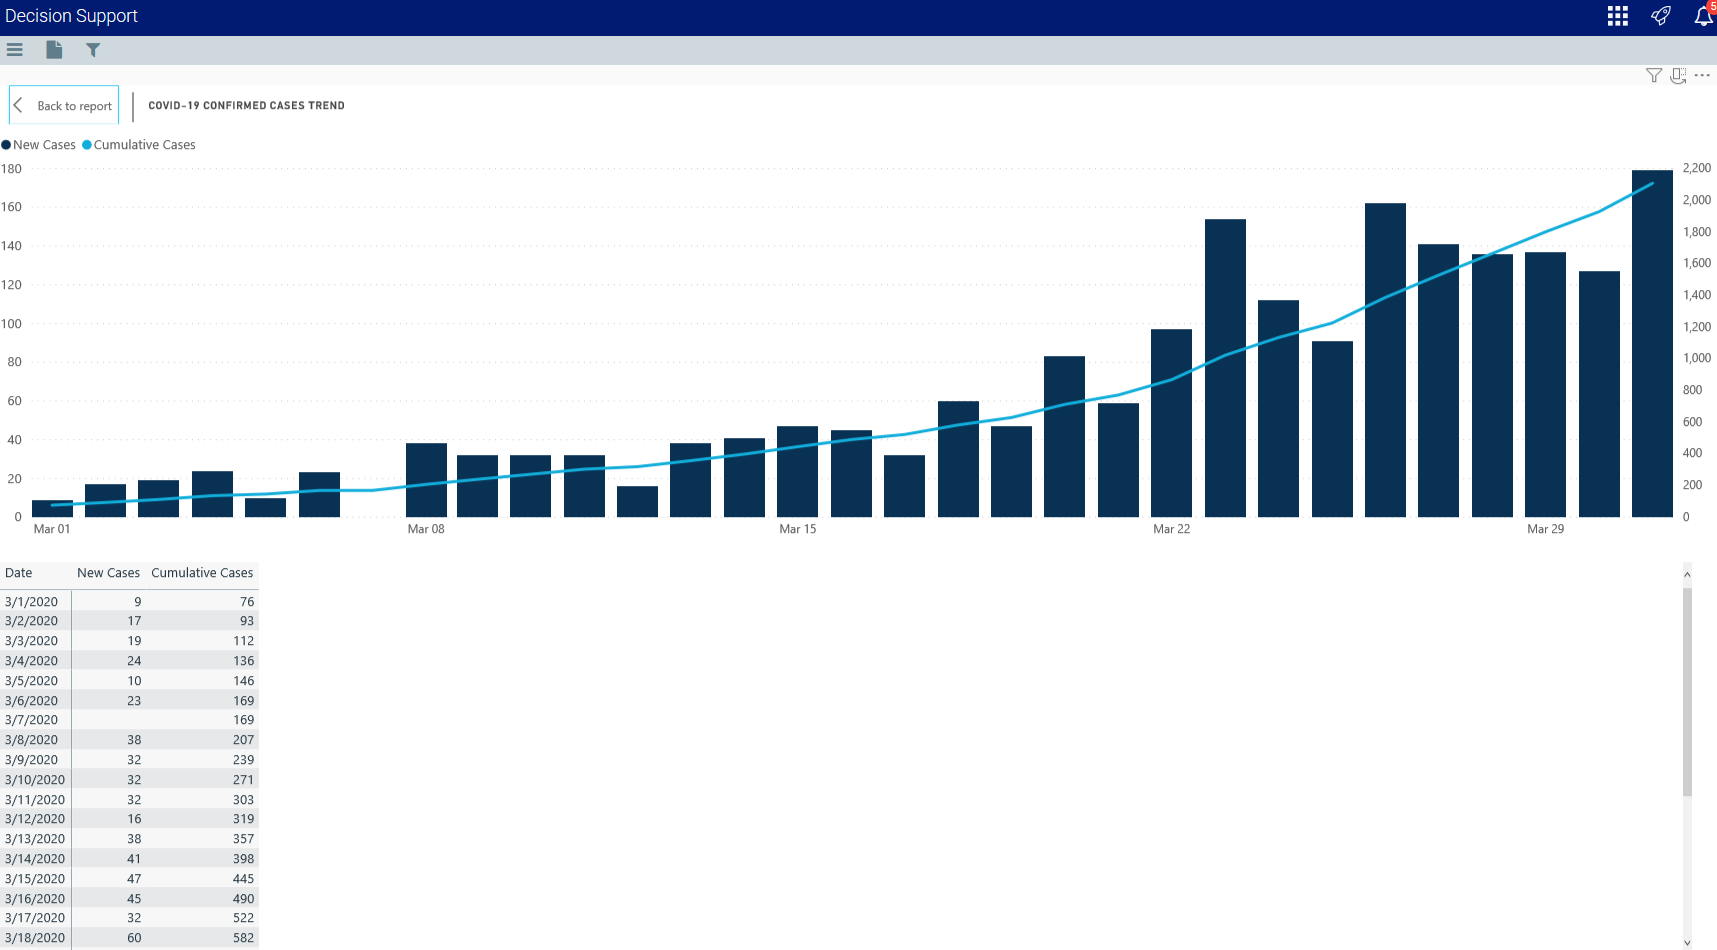
COVID-19 Confirmed Cases Trend
This bar chart displays the number of new cases and a trend line of cumulative cases over time. Hover your cursor over each bar to view a tool tip with details regarding the date and the number of cases for that date.
Click image to view full size
Cases by Sex, Age, and Race
These visuals display demographic information for the COVID-19 patient population. Hover your cursor over the chart elements to view a tool tip with the number of each type (the Cases by Sex chart also displays the percentage of total patients for each sex).

Click image to view full size
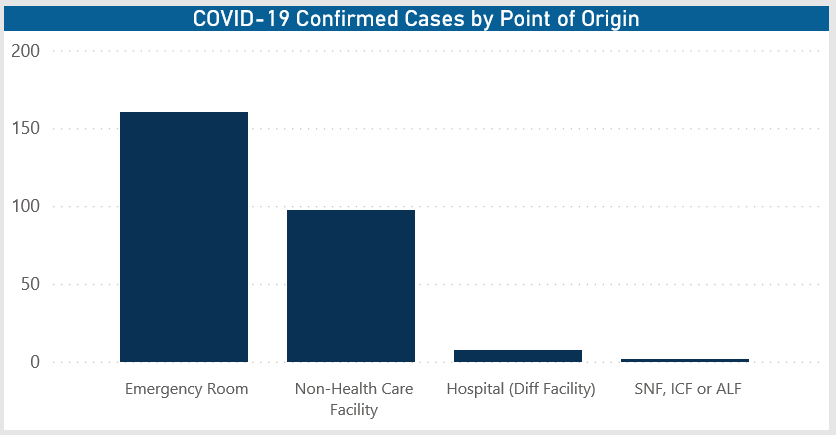
COVID-19 Confirmed Cases by Point of Origin
This chart shows the location in patients are admitted. Hover your cursor over each bar to view a tool tip with a description of the admittance location description and the number of patients admitted at that location.
Click image to view full size
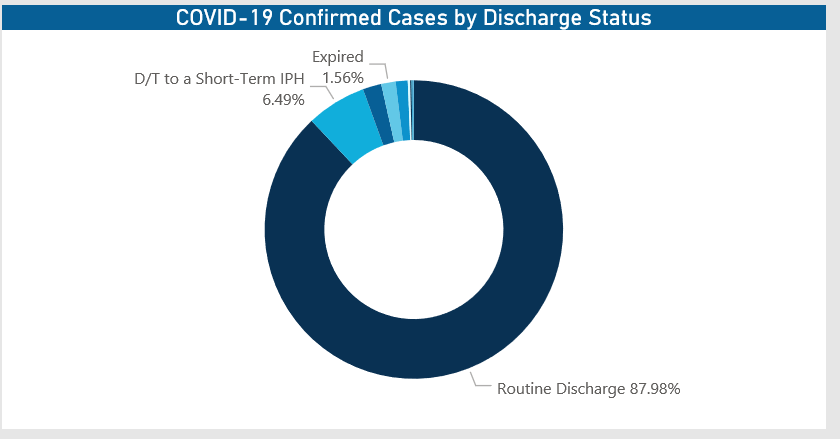
COVID-19 Confirmed Cases by Discharge Status
This visual shows a breakdown percentage of patients by discharge status. Hover your cursor over the individual sections of the visual to view a tool tip of the discharge status description and number of patients with that status.
Click image to view full size
Confirmed COVID-19 Cases by Patient Type
This graph provides a visual representation of the number of patients by type. Hover your cursor over each square to view a tool tip with the patient type description and number of cases for that type.

Click image to view full size
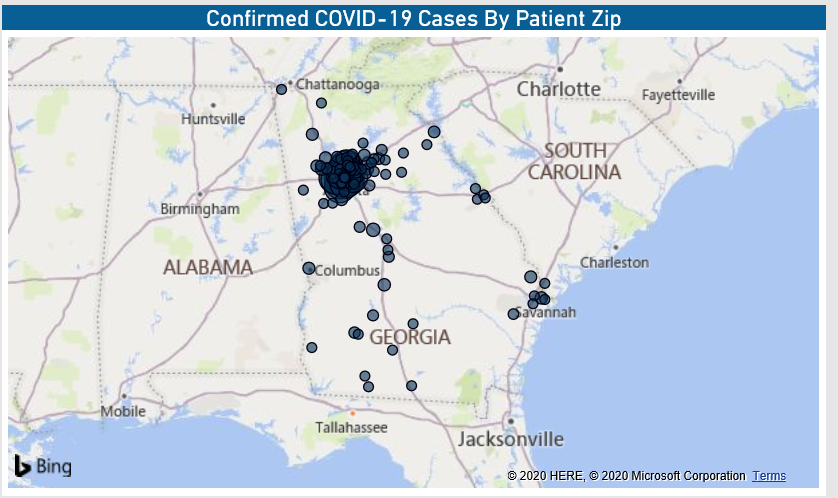
Confirmed COVID-19 Cases by Patient Zip
This section displays the cases by location using a map. From here, you can do the following:
- Zoom in and out of the map by using the scroll button on your mouse. You can move the map by holding down the left mouse button and moving the mouse to the area to view.
- View the zip code and number of visits for that zip code by hovering your cursor over a dot on the map.
- View information about visits specific to that zip code by clicking a dot on the map, and the sections on the page will adjust accordingly.
Click image to view full size
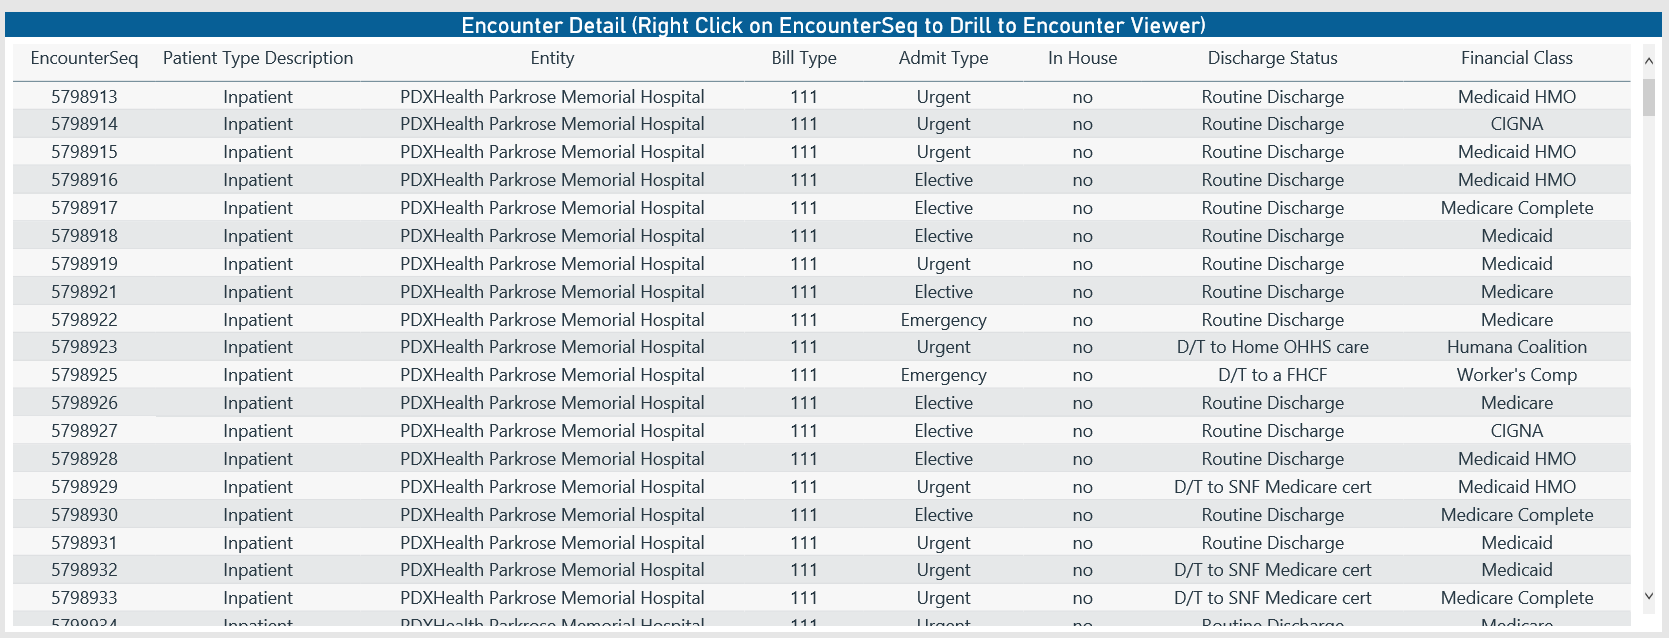
Encounter Detail
This table displays the details for each encounter for the population. From this table, you can do the following:
- Change the report visuals for a specific encounter by clicking a row. The system greys out the details for the other descriptions across the page except for data specific to the description you selected.
- Sort the table by columns in ascending or descending order by clicking the column header.
-
Drill through the data by right-clicking the row, and then selecting Drill Through.
Click image to view full size
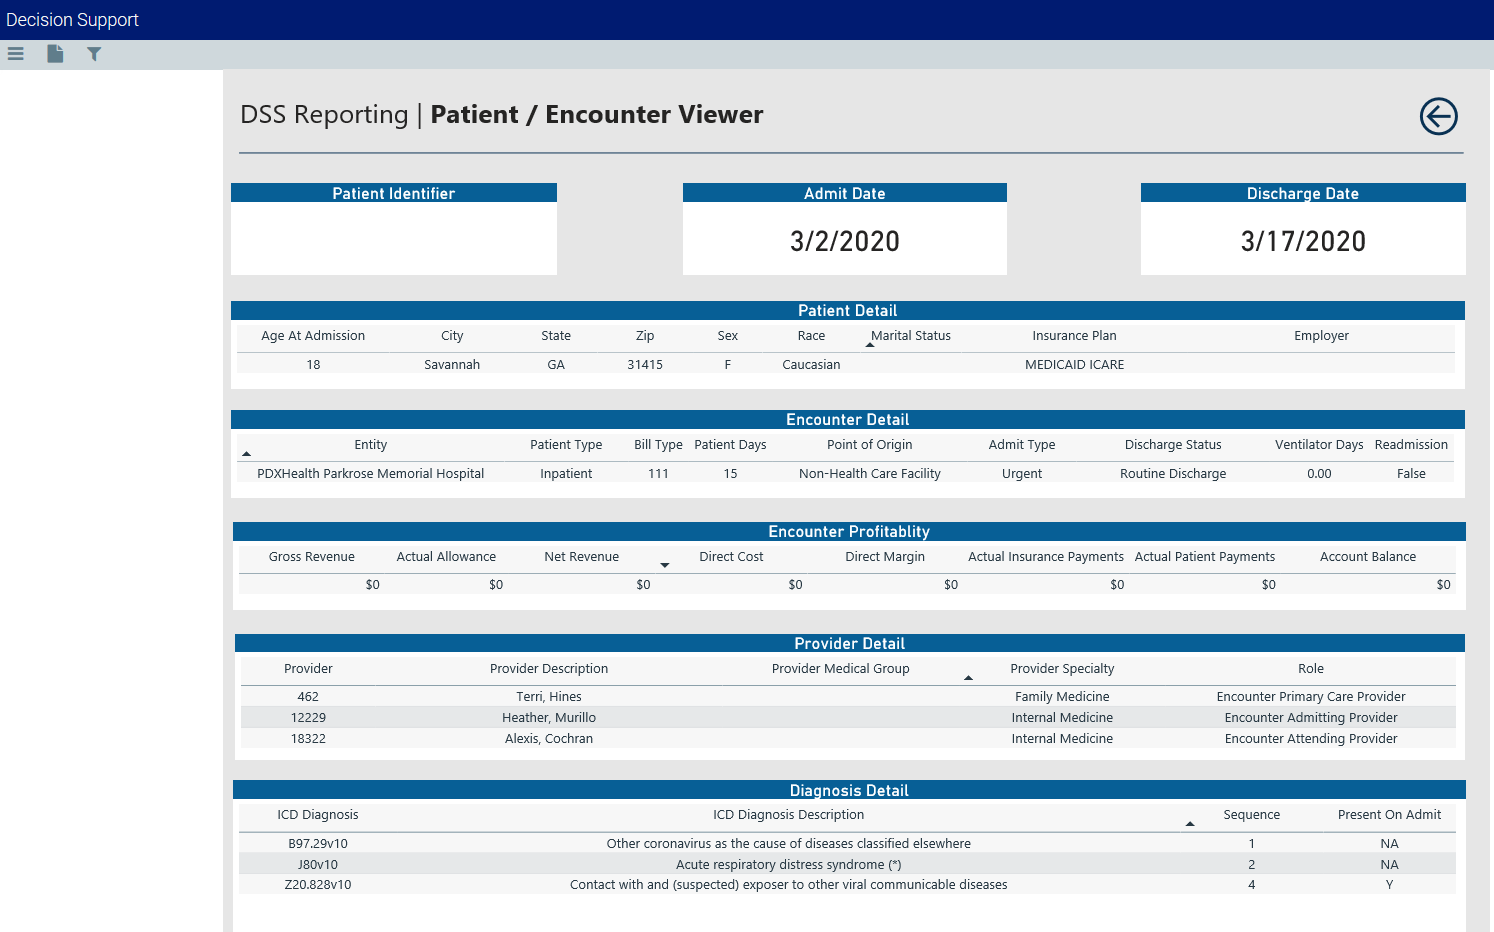
Patient/Encounter Viewer
When you drill through to a specific encounter from the Encounter Detail table, the Patient/Encounter View page displays, which includes details regarding:
- Patient Identifier
- Admit Date
- Discharge Date
- Patient Detail
- Encounter Detail
- Encounter Profitability
- Provider Detail
- Diagnosis Detail
- Procedure Detail
- CPT Detail
- Charge Detail
In each table section, you can sort the information by columns in ascending or descending order by clicking the column header. To return to the COVID-19 Population Analysis report, click the arrow in the upper-right corner of the page.
Click image to view full size
Viewing data in table format
You can view the underlying data for the visualizations and tables in the report by right-clicking the graph or table, and clicking Show as a table. A data table displays underneath the graph or table. To return to the dashboard, click Back to report in the upper left corner of the page.
Click image to view full size
